Interpreting results
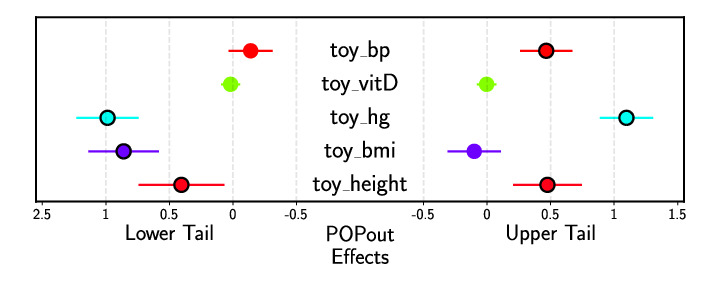
Running the python3 commands described in the previous page will produce the following figure (test-effects.pdf) the shows trait POPout Effect Sizes:
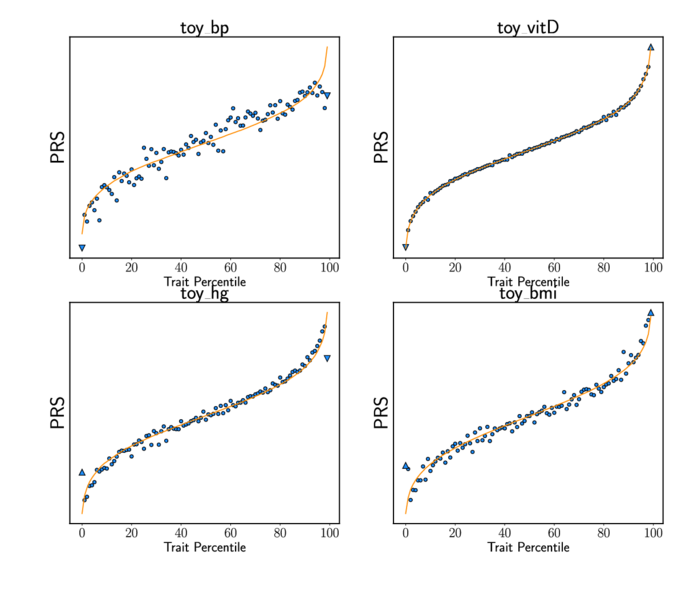
It will also produce a figure displaying the POPout distributions for each trait (test-dists.pdf):
Finally, it will also produce an output file (test-results.txt) that displays the POPout test results with one row per trait. Running the R script will also produce this output.
For more information on the output file format see Guide: Output Data.